

Getting started
This guide takes you from zero to your first demand-driven metrics in a few minutes.
1. Create an account and a tenant
Section titled “1. Create an account and a tenant”Sign up at cc.leansignal.io/onboard — no
credit card required — and confirm your email. You’ll then set up your
tenant: pick the short name that becomes your URL
(<short-name>.leansignal.io) and choose your sign-in methods. Provisioning
takes seconds. See Tenants & workspaces and
Accounts & authentication for the details.
2. Create an agent and key
Section titled “2. Create an agent and key”In the LeanSignal app, go to Agents → Add Agent and give it a name (for
example prod-eu-central). Open the new agent and copy its agent key
(admins can reveal and copy it) — you’ll pass that key to the installer in the
next step.
3. Install the agent
Section titled “3. Install the agent”Deploy the LeanSignal Agent into the cluster or environment you want to observe — one agent per cluster or environment. See Install the agent for Linux, macOS, Windows, Kubernetes, and Docker instructions. Once it dials in, the agent shows as Connected in the Agents view.
4. Activate your first demand
Section titled “4. Activate your first demand”A demand is the set of telemetry you want to keep — metrics, log streams, and traces.
Make your first demand the agent itself. The agent you just installed already monitors itself — connection health, throughput, export failures, memory — on every platform and install type, with nothing to enable. That makes the LeanSignal Agent integration the one first demand that is guaranteed to have data flowing the moment you import it:
-
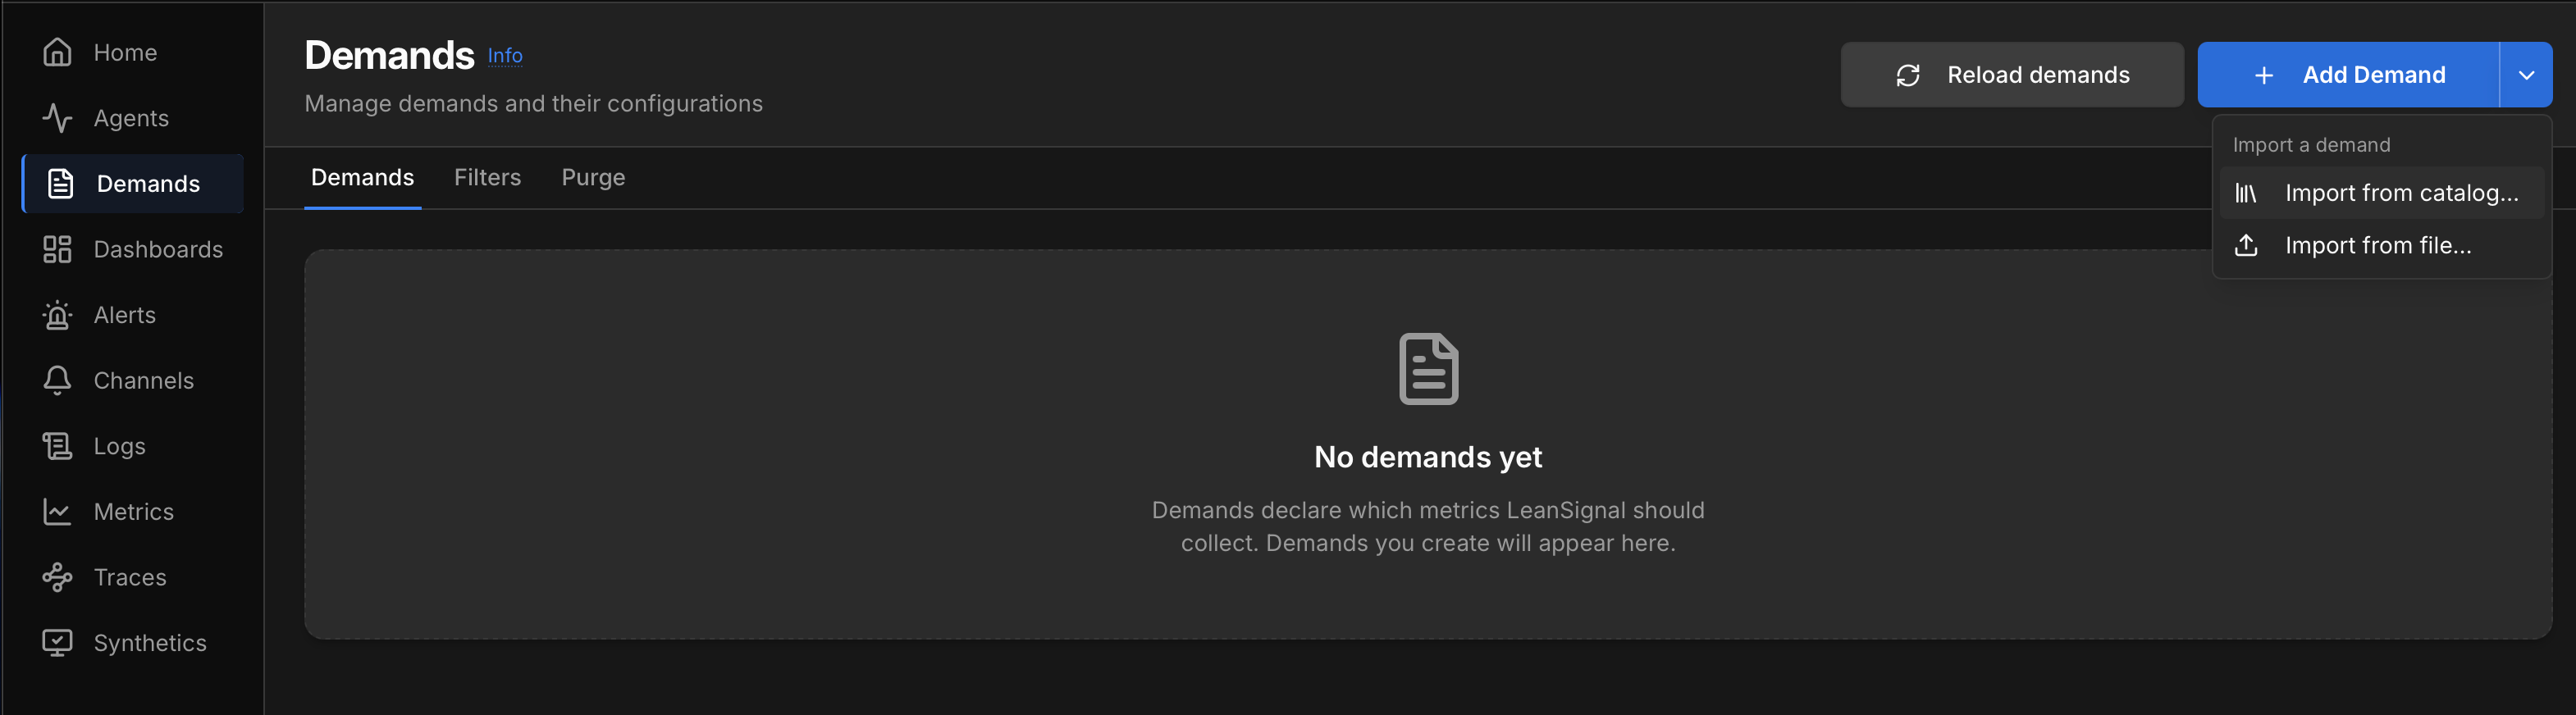
Go to Demands and press the ˅ down arrow on the right edge of the Add Demand button — the arrow opens the import menu (the button itself starts an empty demand instead).
-
Choose Import from catalog… and pick LeanSignal Agent (the Standard variant is the recommended default), then confirm with Import demand.
-
Open the imported dashboard — it shows data within seconds. On the Agents page, watch Ingesting timeseries move off
0/N: those are the agent’s own metrics, now demanded and forwarding.
You’ve now seen the whole loop — collect, demand, forward — on data you didn’t have to produce. From here, grow demand the same three ways:
- Import an integration for something you run — Host Metrics is the natural second pick on host installs. See Integrations.
- Build a dashboard — dashboards express demand automatically; while you edit, preview queries run against the agent’s local full-fidelity store, so you chart real data before it is demanded.
- Create a demand directly under Demands → Add Demand.
5. Watch the noise disappear
Section titled “5. Watch the noise disappear”As soon as a demand is active, LeanSignal pushes the resulting demand set to every connected agent. Each agent forwards only that subset — the demanded metrics, log streams, and traces — to your central dataplane, and the Agents view shows the timeseries stored versus the timeseries available at the edge.
Next steps
Section titled “Next steps”- Demand-driven observability — the core idea in depth.
- Architecture — the pain cycle vs the value cycle, and the components behind them.
- Integrations — ready-made demands for common technologies.
- The signals — how each is collected, filtered, and explored: Metrics, Logs (OTLP or the Loki push API), and Traces (OTLP, demand scoped by service).
- The guides: manage agents, work with demands, build dashboards, alerting, and channels.
Thanks for your feedback!
Report sent — thank you!